
Skip to content
GitHub
Try the demo

All releases

2026.10.22

Plan a quarter in the Gantt, with stages, the people on them, their time off and working days.

Gantt

Plan with stages

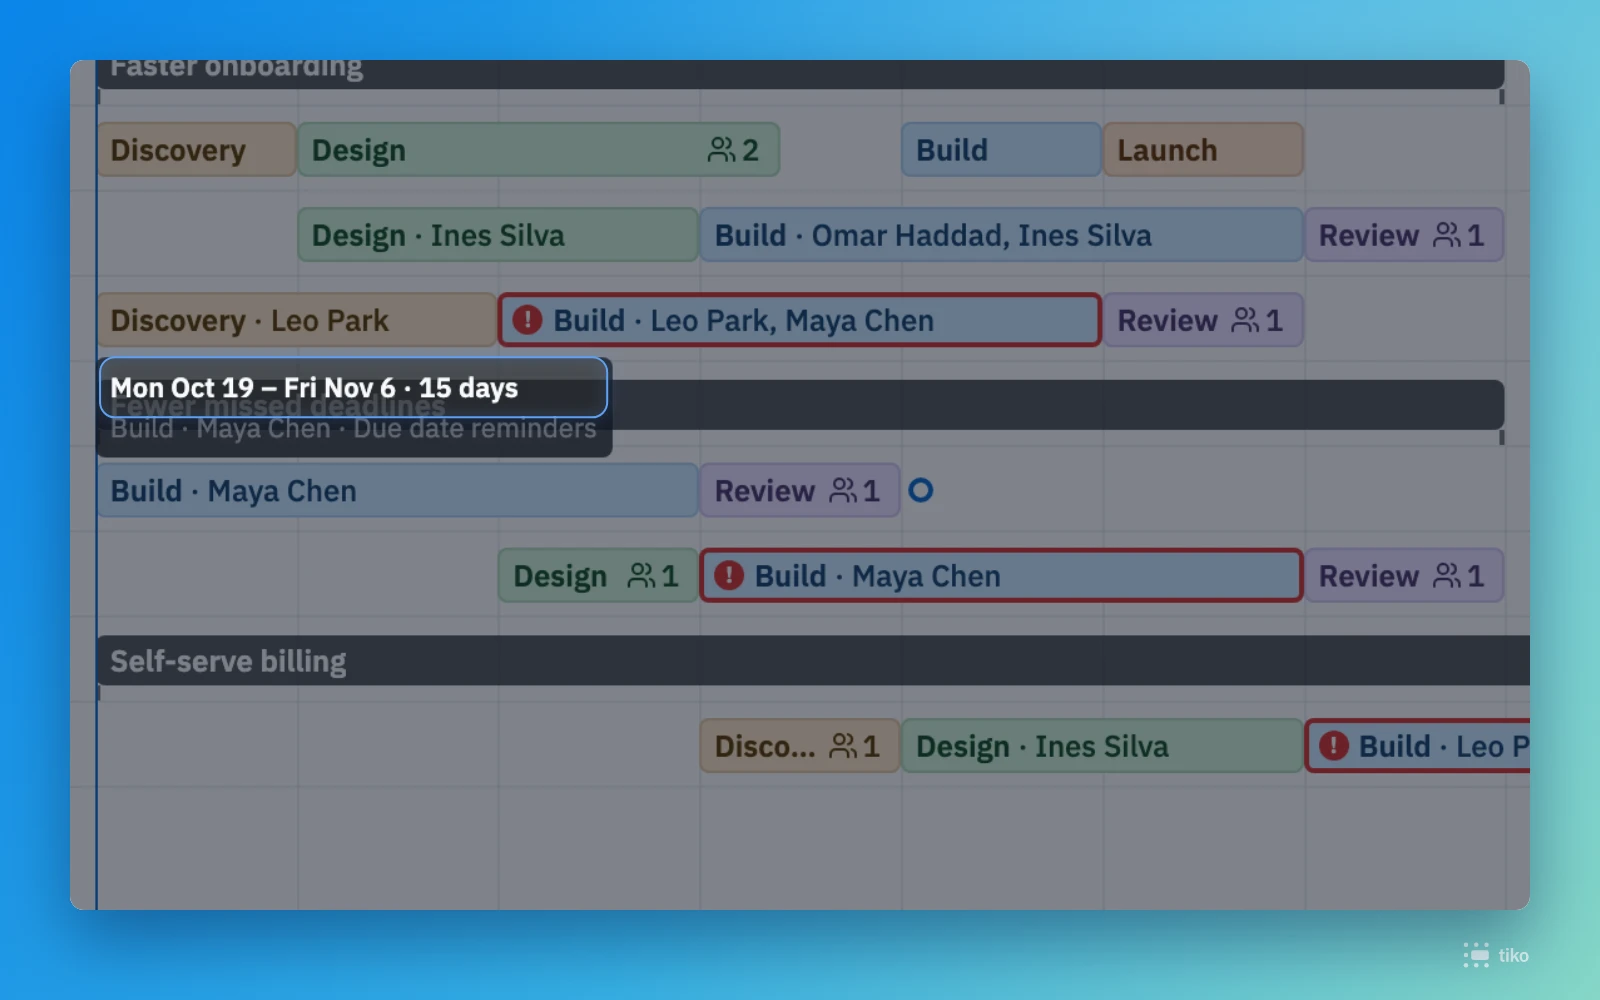
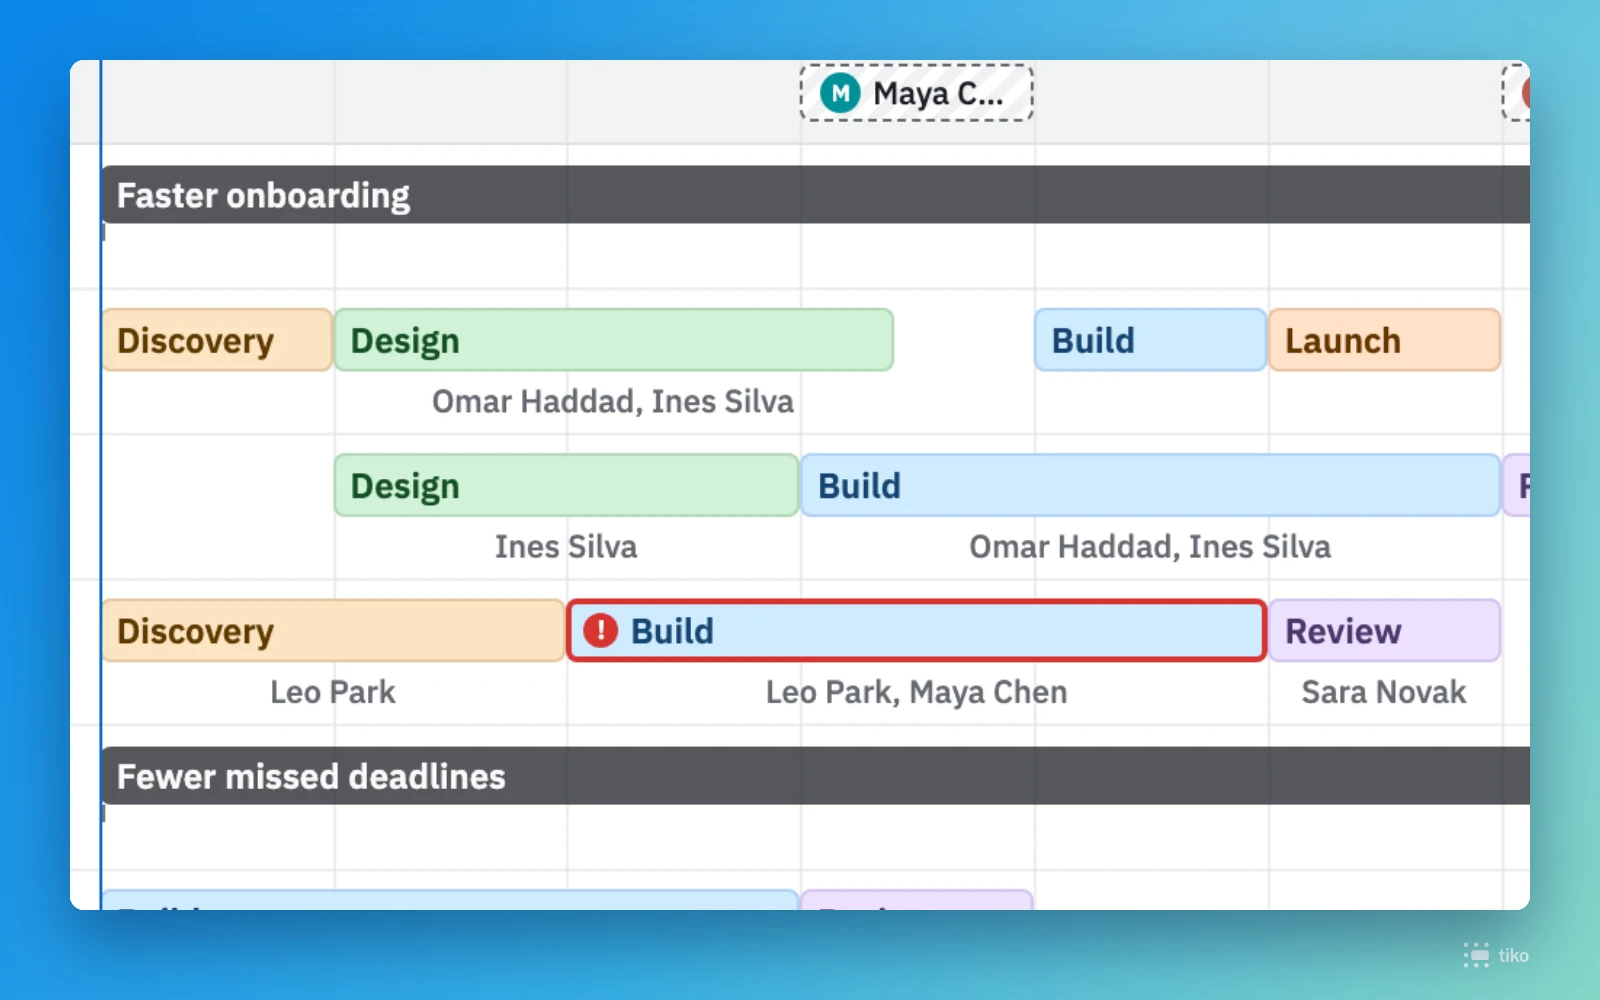
See a whole quarter on one chart: every task is cut into stages such as Discovery, Design and Build, with the people planned for each one. Drag across a row to add a stage, or click for a week, and the next stage picks the type that follows.

What's inside
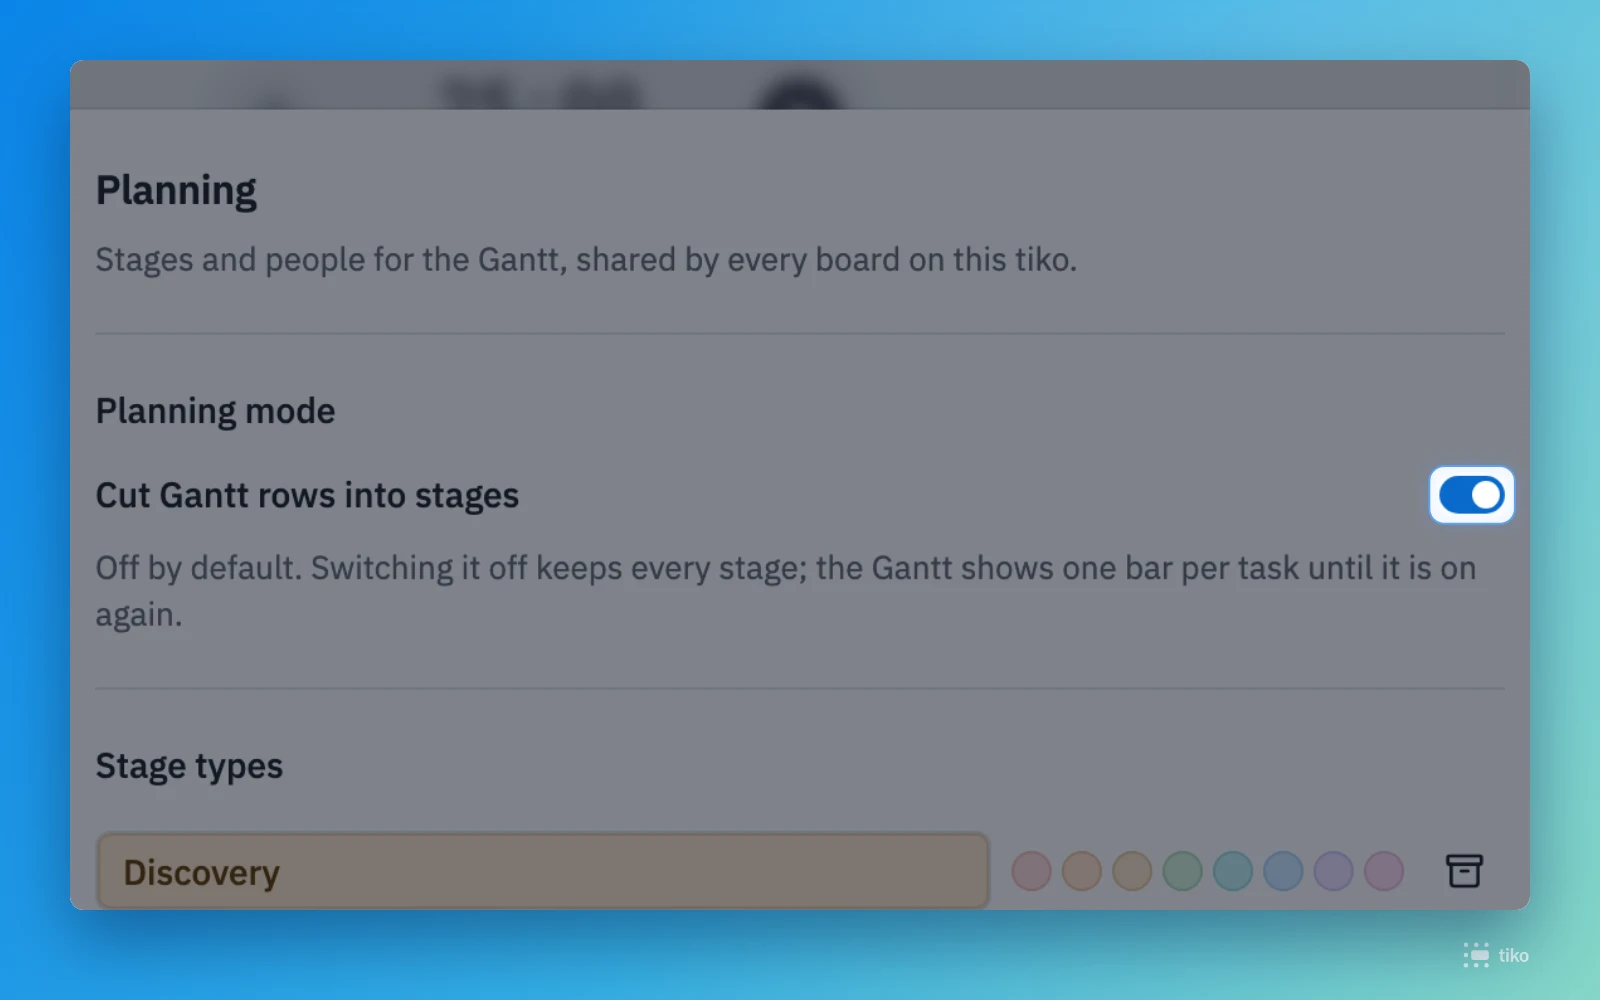
Turn it on once

Planning is off by default. An admin turns it on in Settings, and every Gantt on this tiko gets stages.
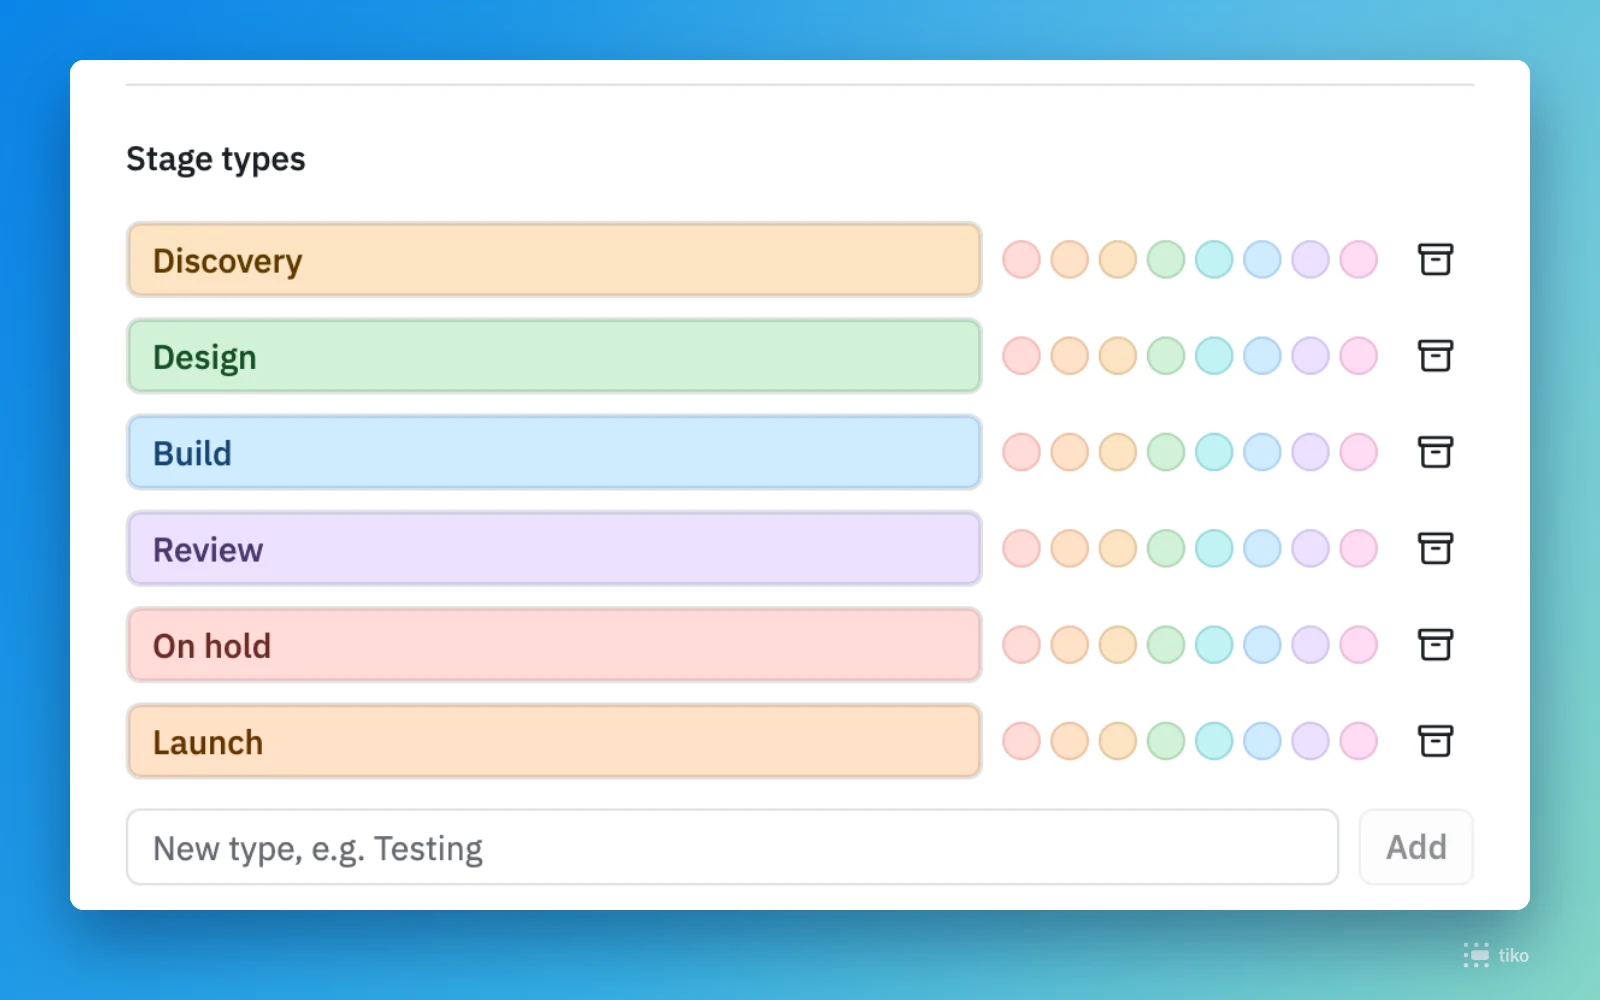
Your own stage types

Rename, recolor or archive the types every board shares, so the chart speaks your team’s words.
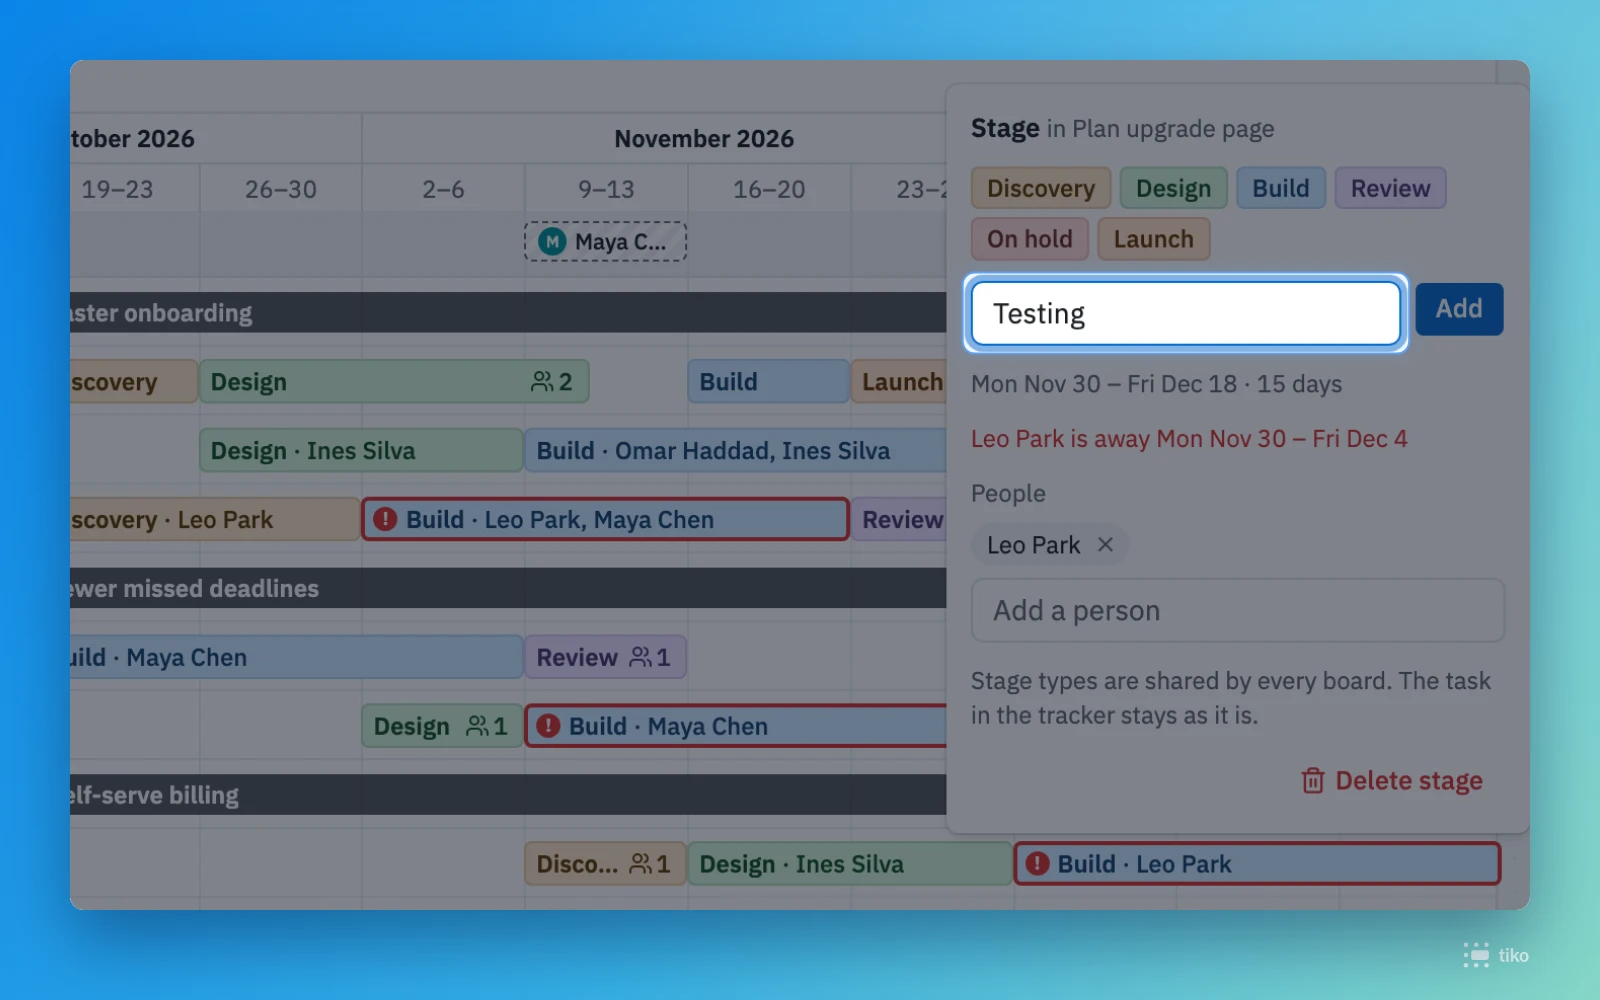
A new type on the spot

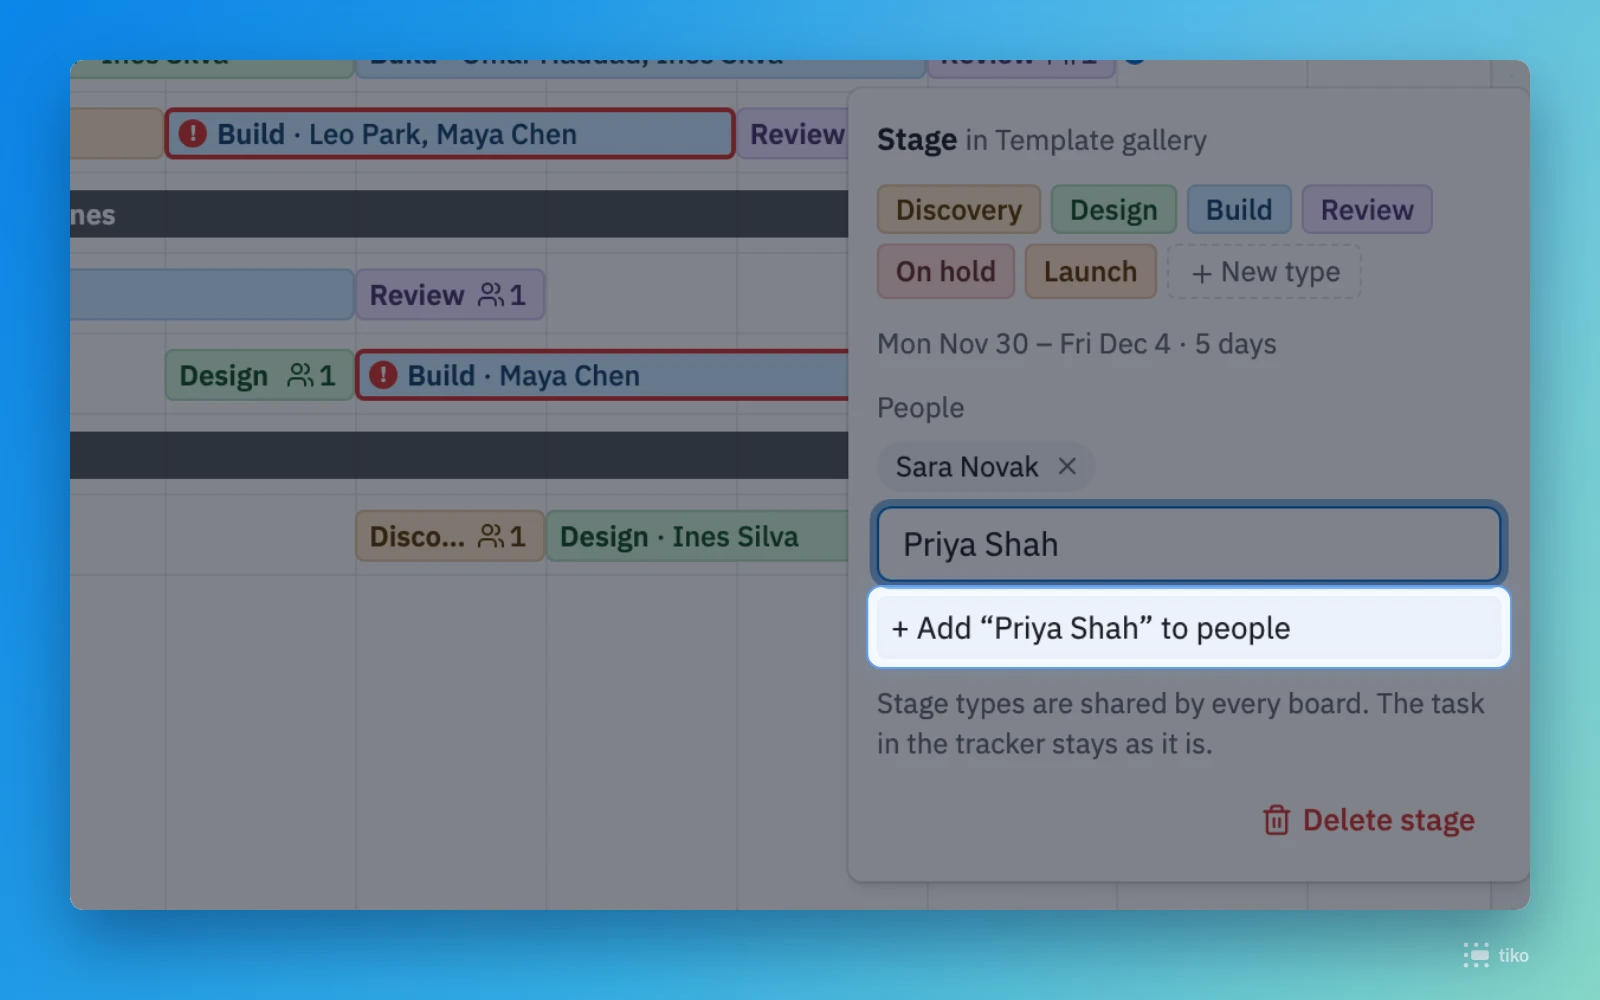
Missing a phase? Add it from any stage with New type, without leaving the chart.
Read in the guide →

Gantt

People on stages

Put people on a stage to see who works on what, and when. They come from one list for the whole tiko, and most of them never need an account.

What's inside

Names where you want them

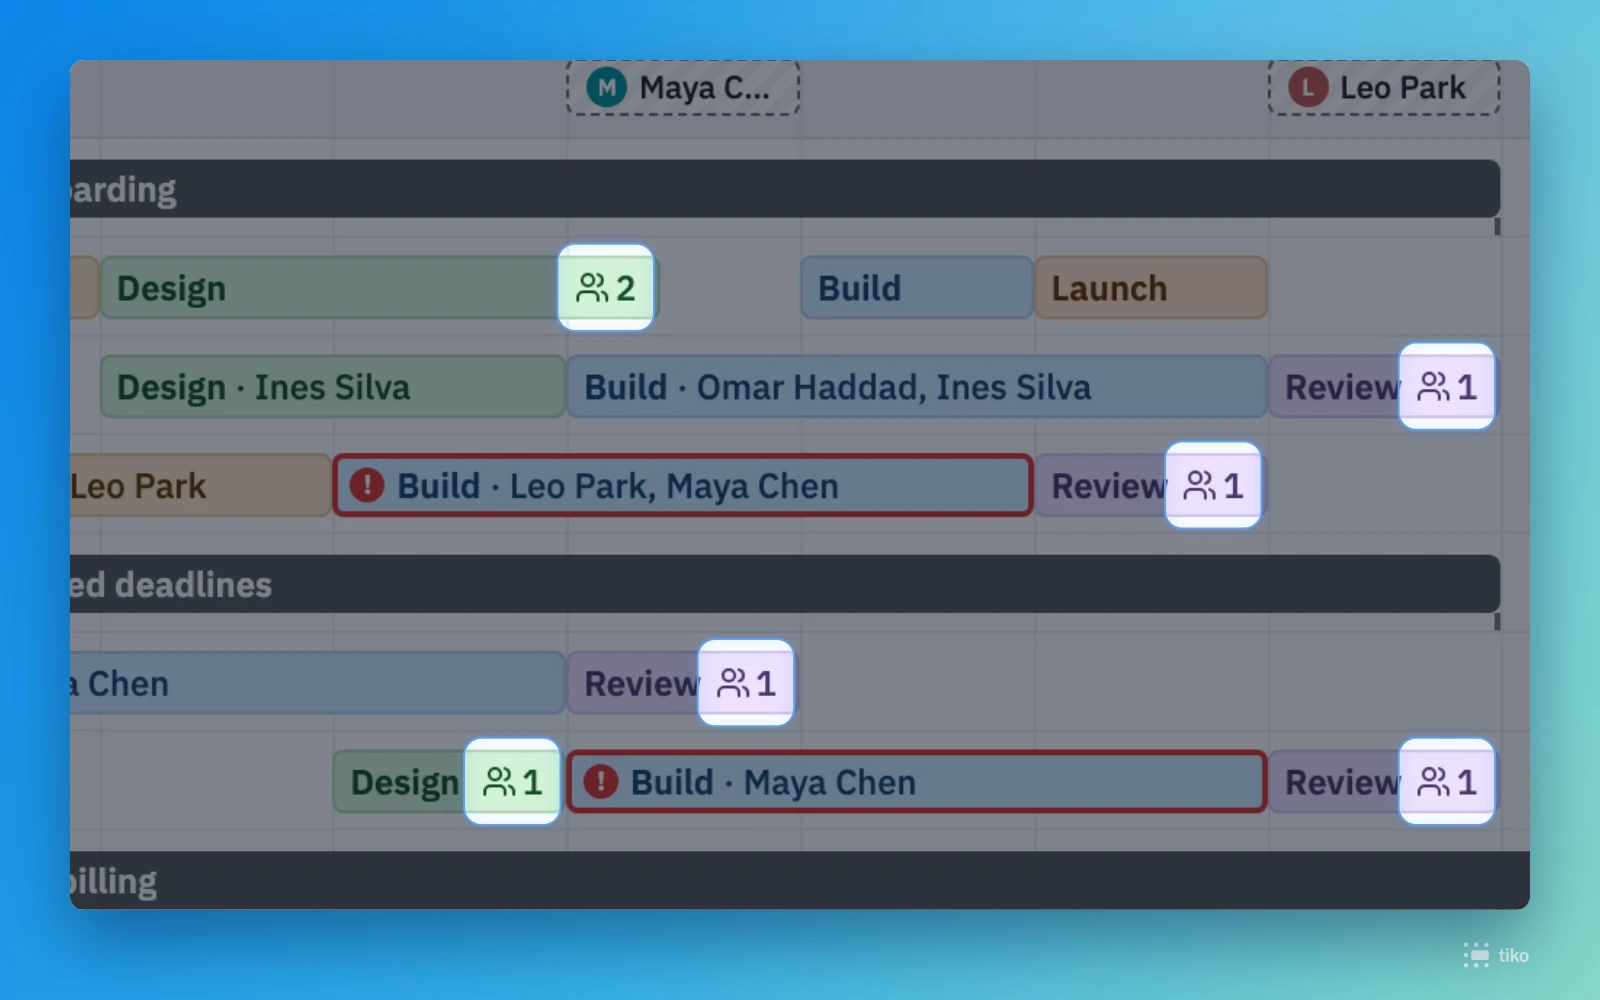
Show names after the stage type, or under each stage when the bars are short.

A count when names don't fit

A short stage shows how many people it has. Click it to see who they are.

Add someone while you plan

Type a new name in a stage and add the person to the list in one step.

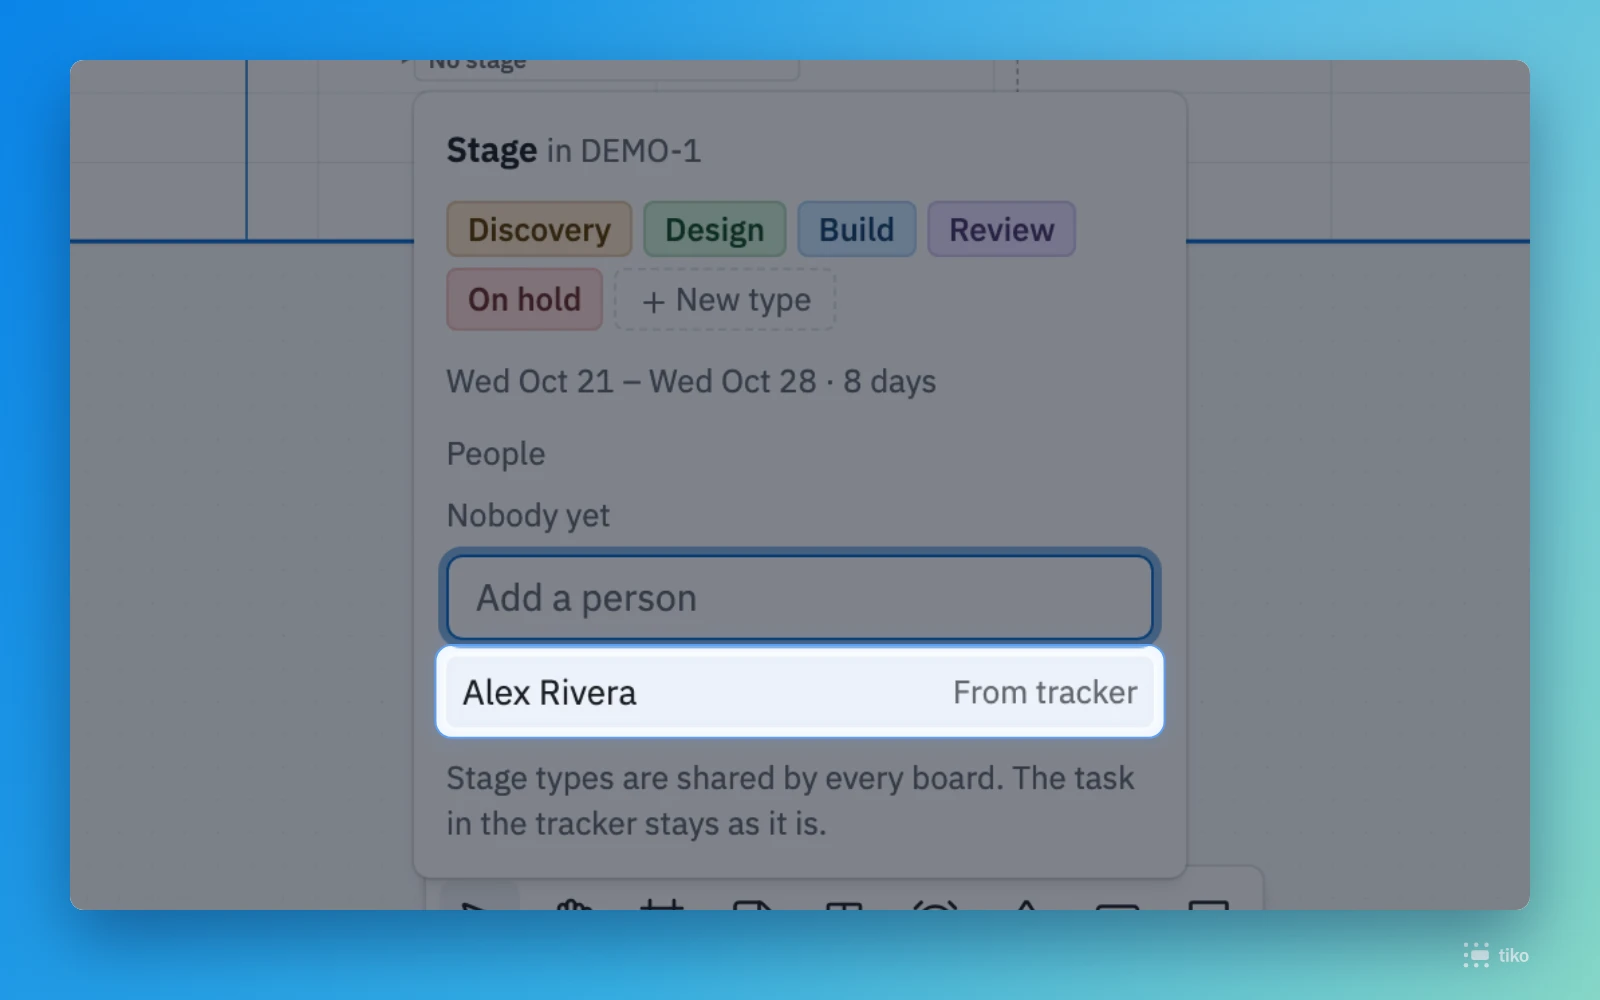
Assignees from your tracker

The assignees of the Gantt’s tasks are offered too. Nobody is added until you pick them.

One list for every board

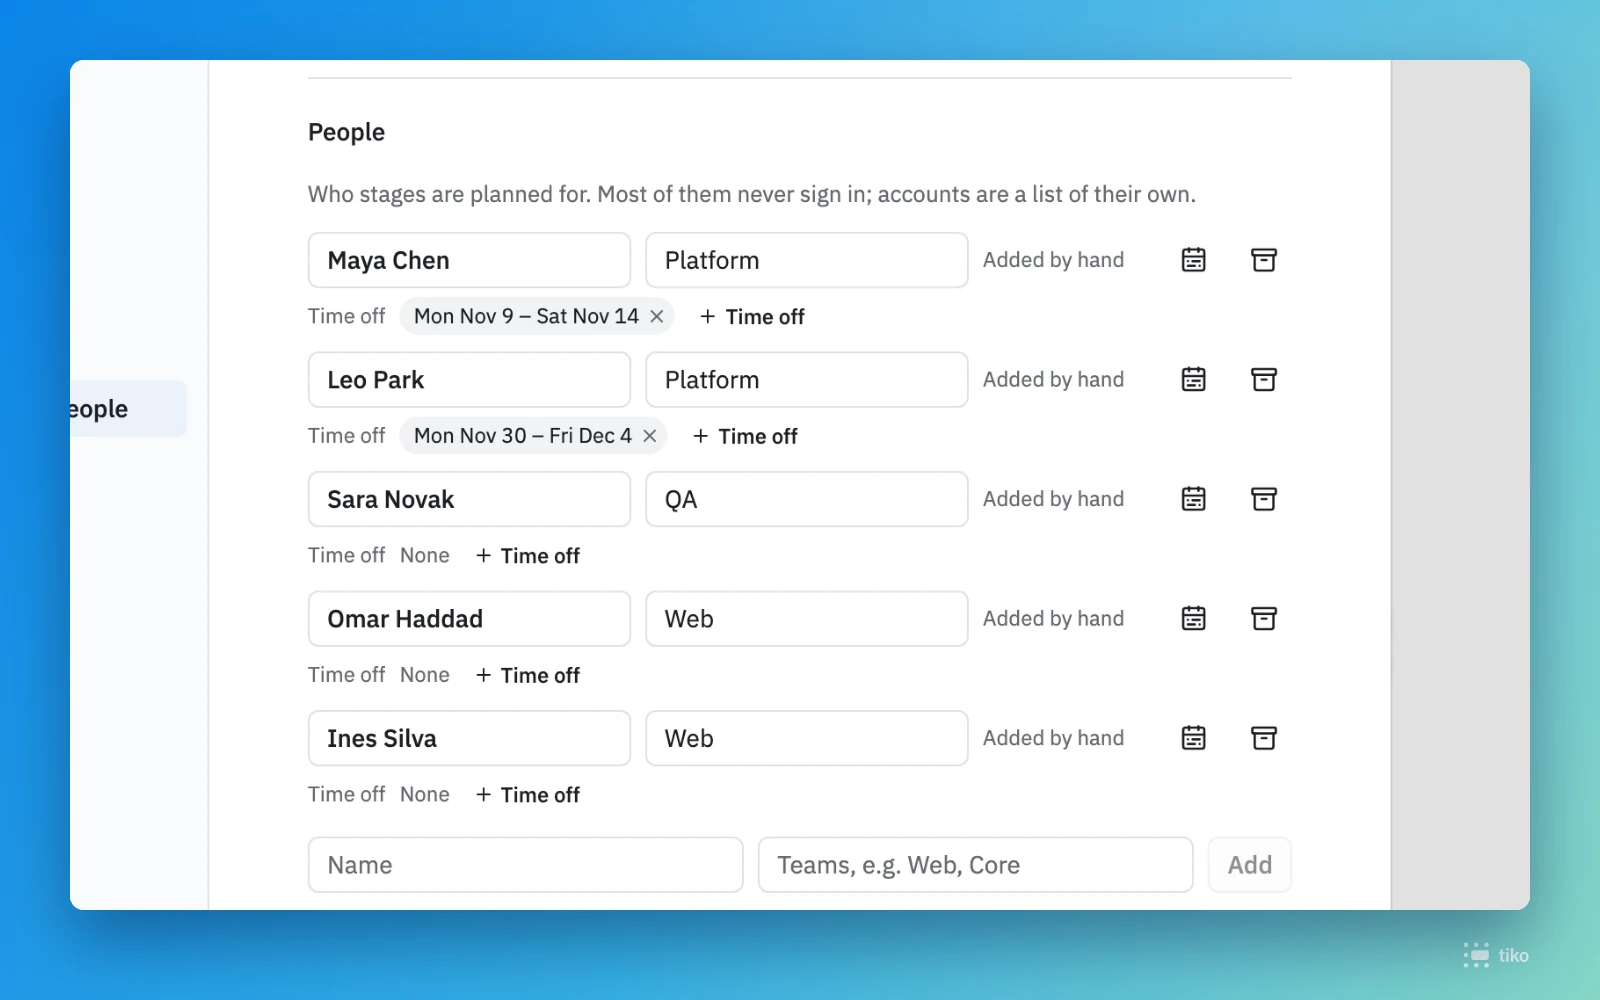
Keep names and teams in Settings. Teams then work in filters across every Gantt.

Read in the guide →

Gantt

Columns

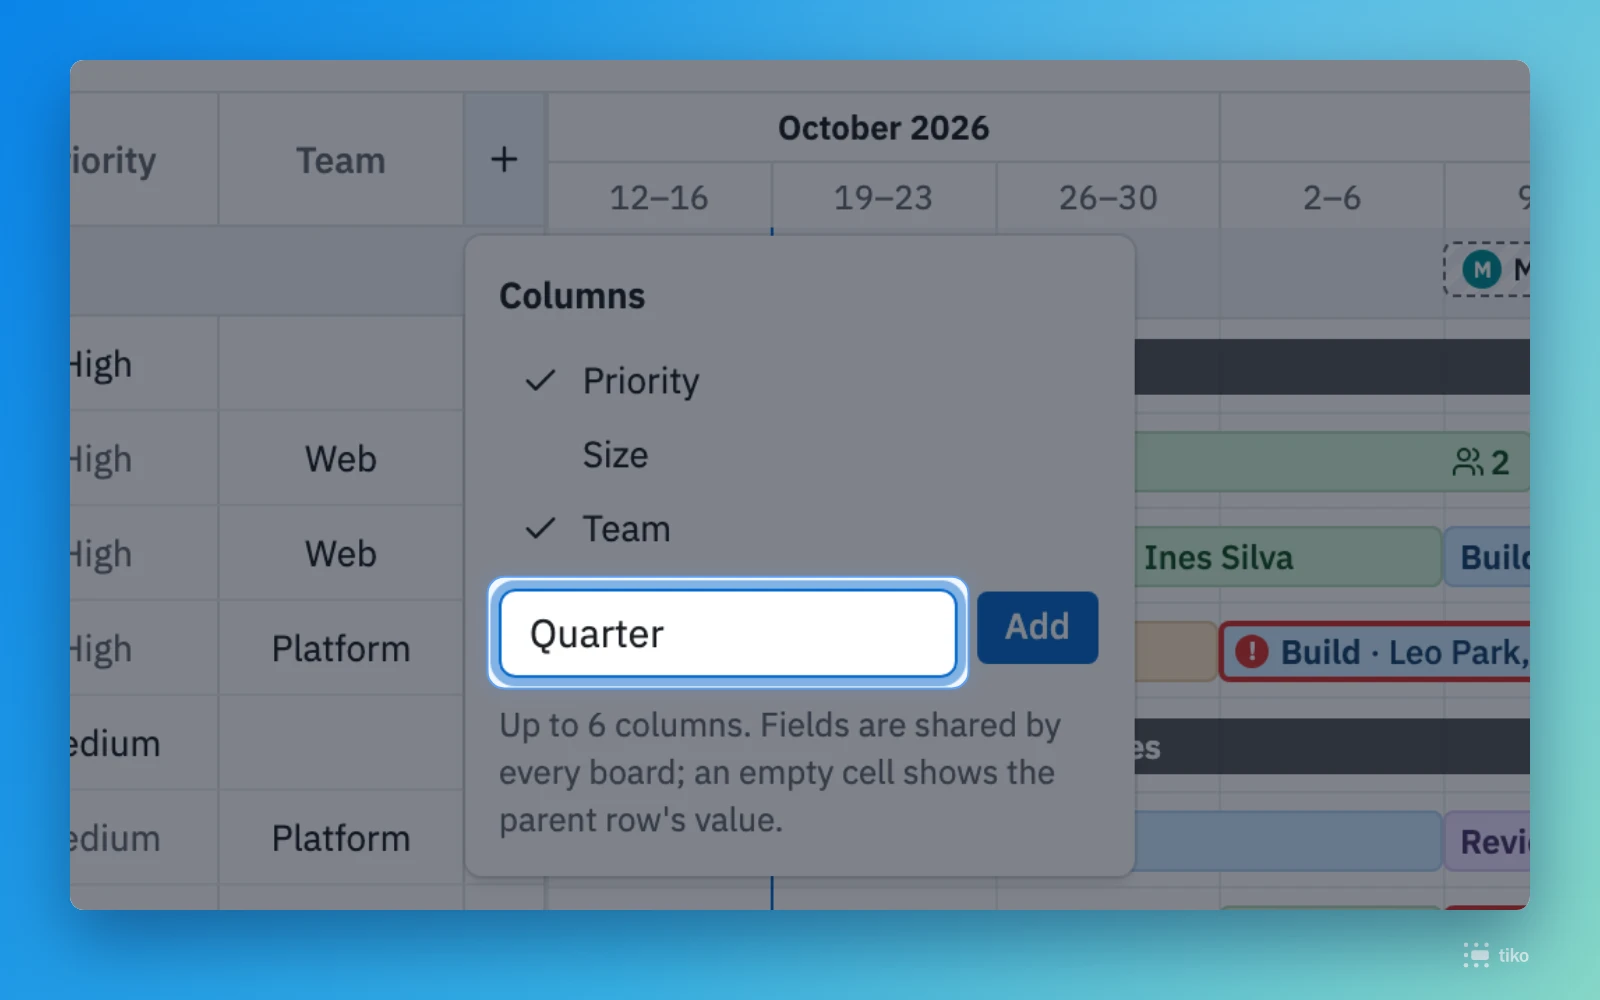
Show Priority, Size, Team or a field of your own next to the task titles, and type values straight into the cells. Values stay on the board and never go to your tracker.

What's inside

Children follow the parent

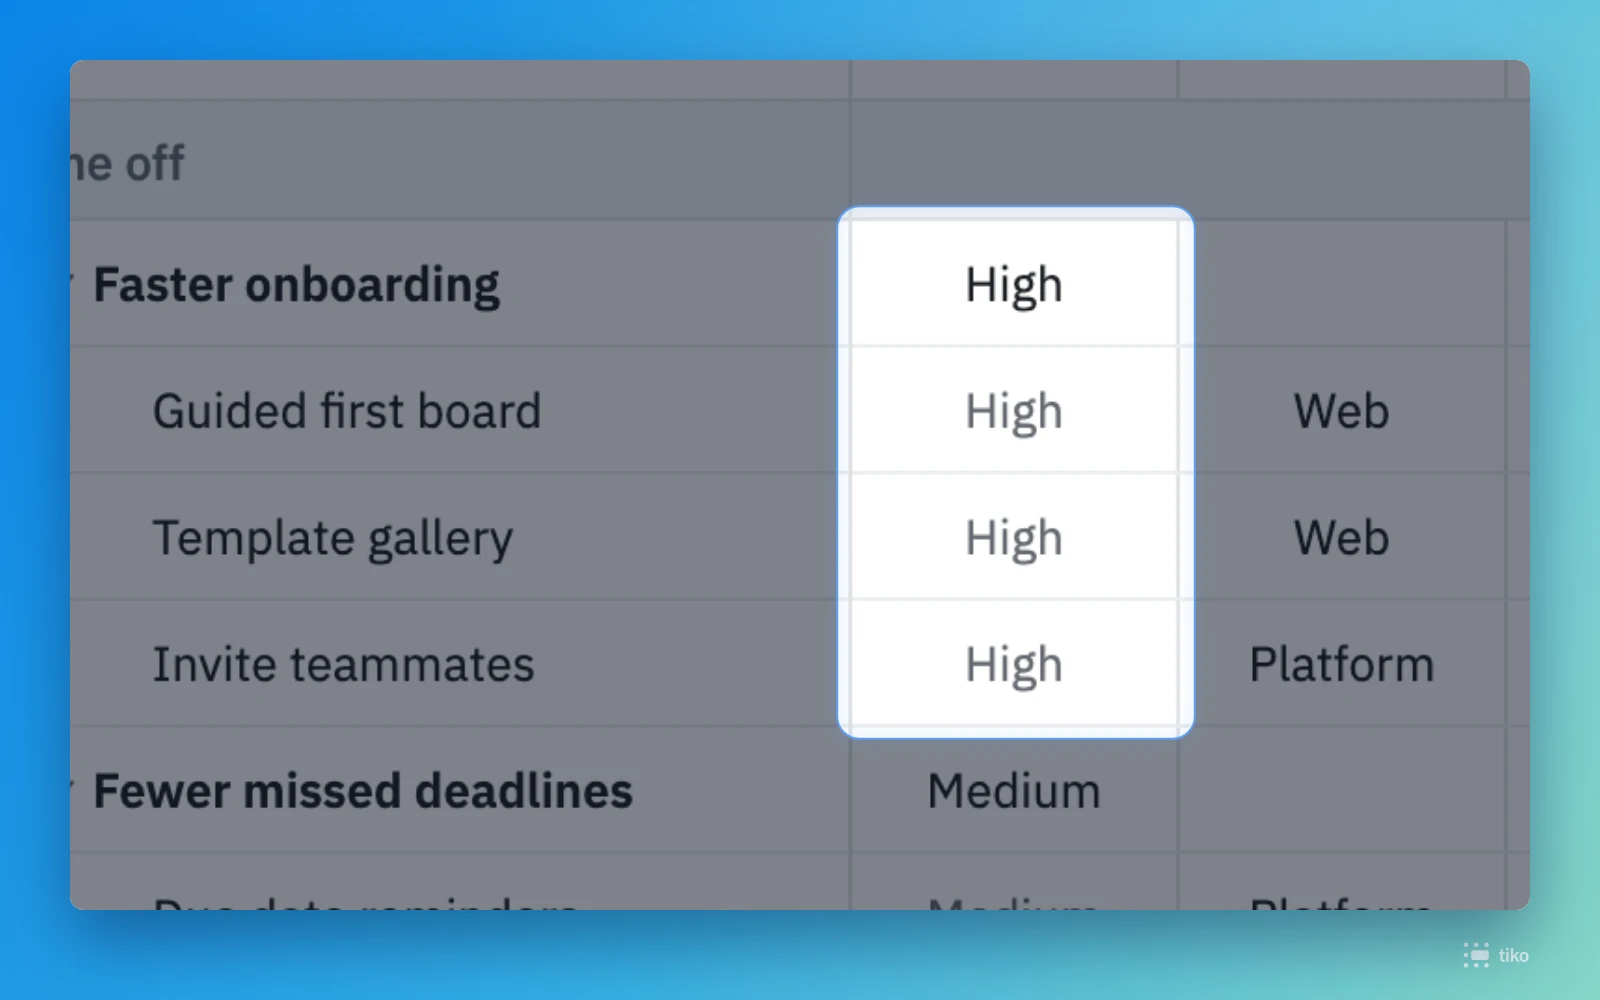
Set a value once on a parent row and its children show it in gray. Type over it where a child differs.

A field of your own

Need a Quarter or a Budget code? Type its name, and every Gantt can show it.

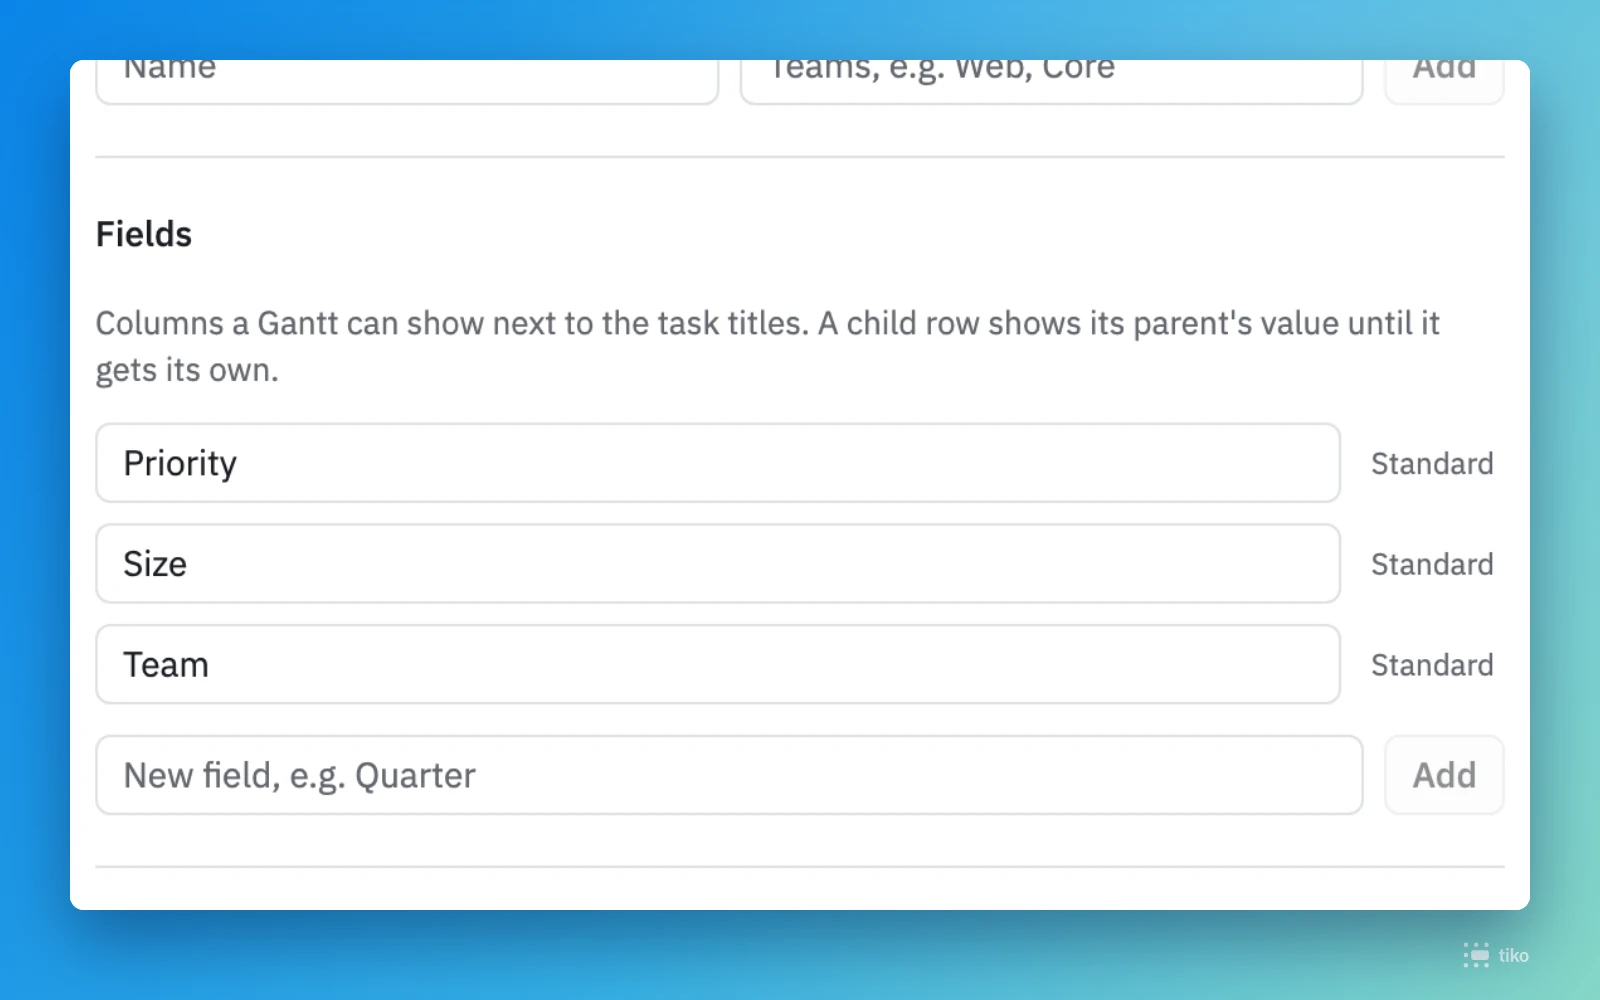
Fields in Settings

Rename the standard fields or archive your own. Archived fields keep their values in the rows.

Read in the guide →

Gantt

Filters and views

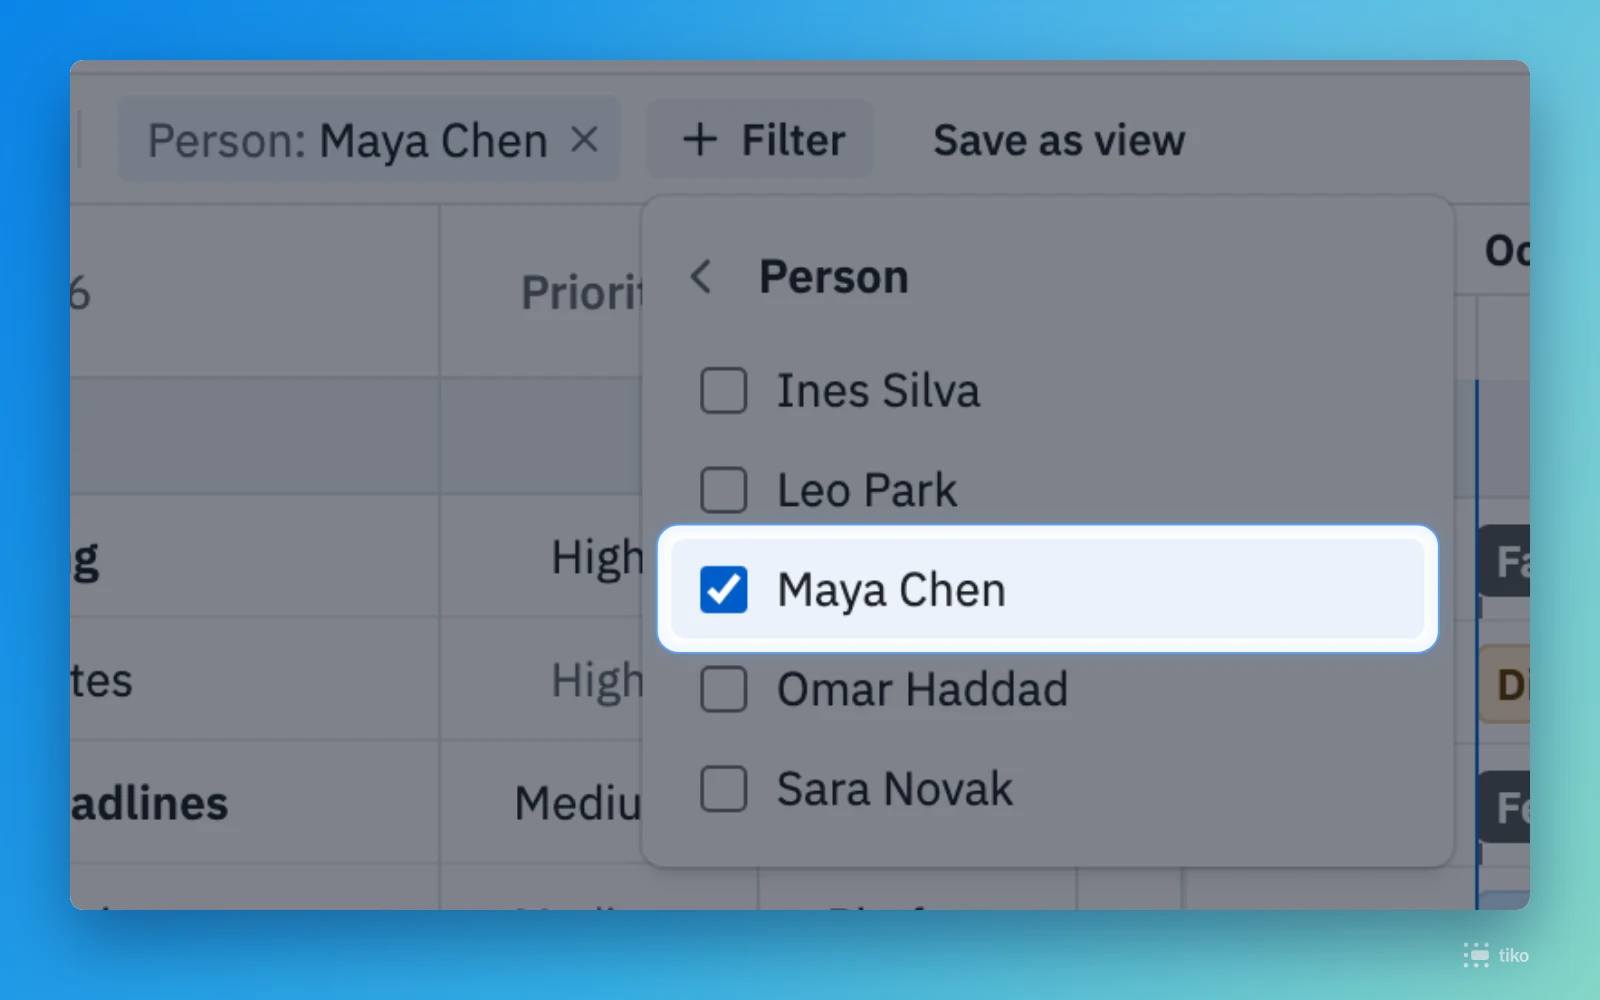
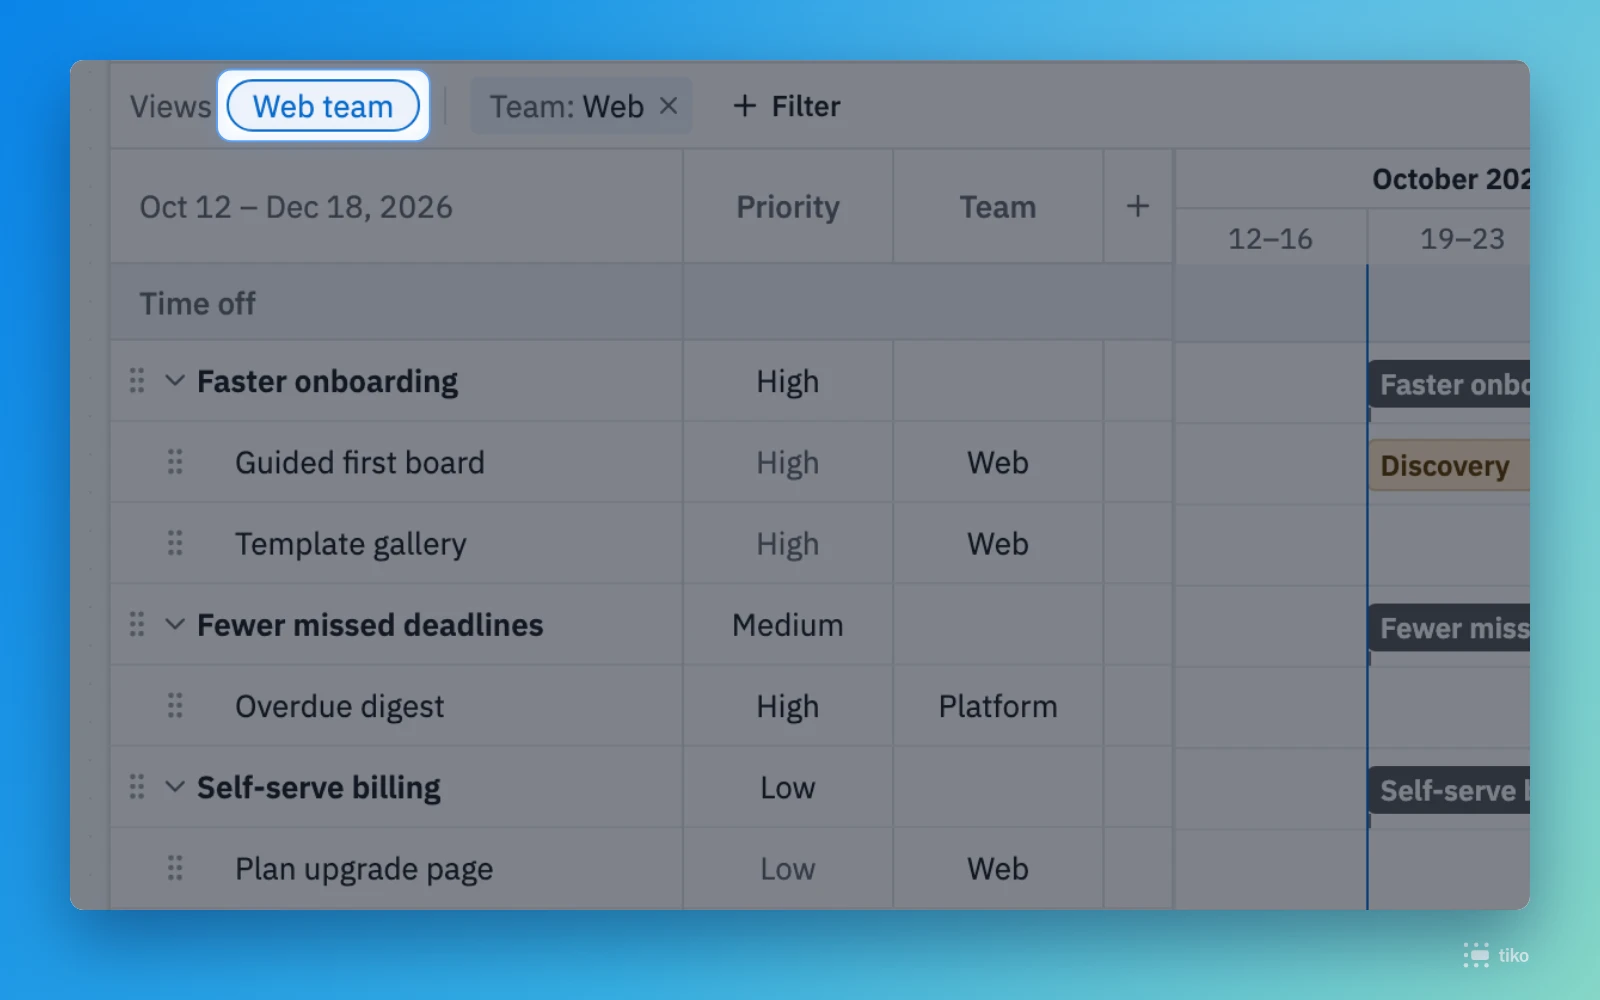
Narrow a busy chart to one team, one person or one priority. Save the filters as a view, and every Gantt on this tiko can apply it in one click.

What's inside

Where a team takes part

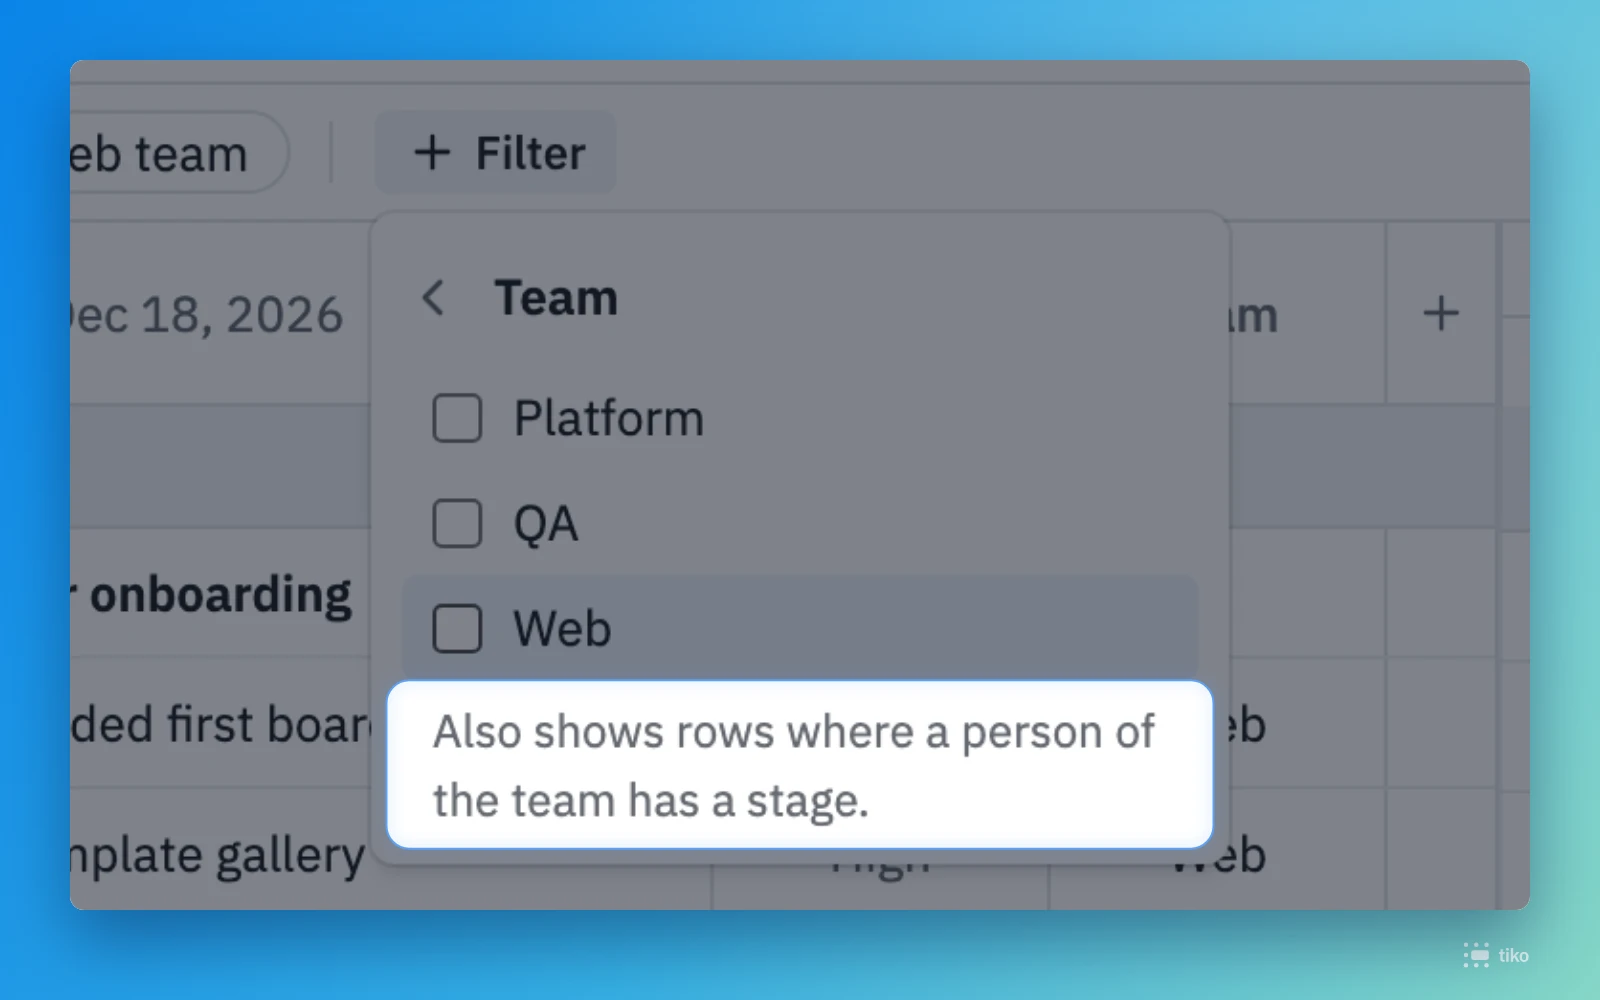
A team filter also finds tasks owned by other teams where one of its people has a stage.

One person's plan

Filter by a person to see only the tasks they work on.

Views for every Gantt

Saved views sit above the rows. Click one to apply it, click it again to show every task.

Read in the guide →

Gantt

Time off

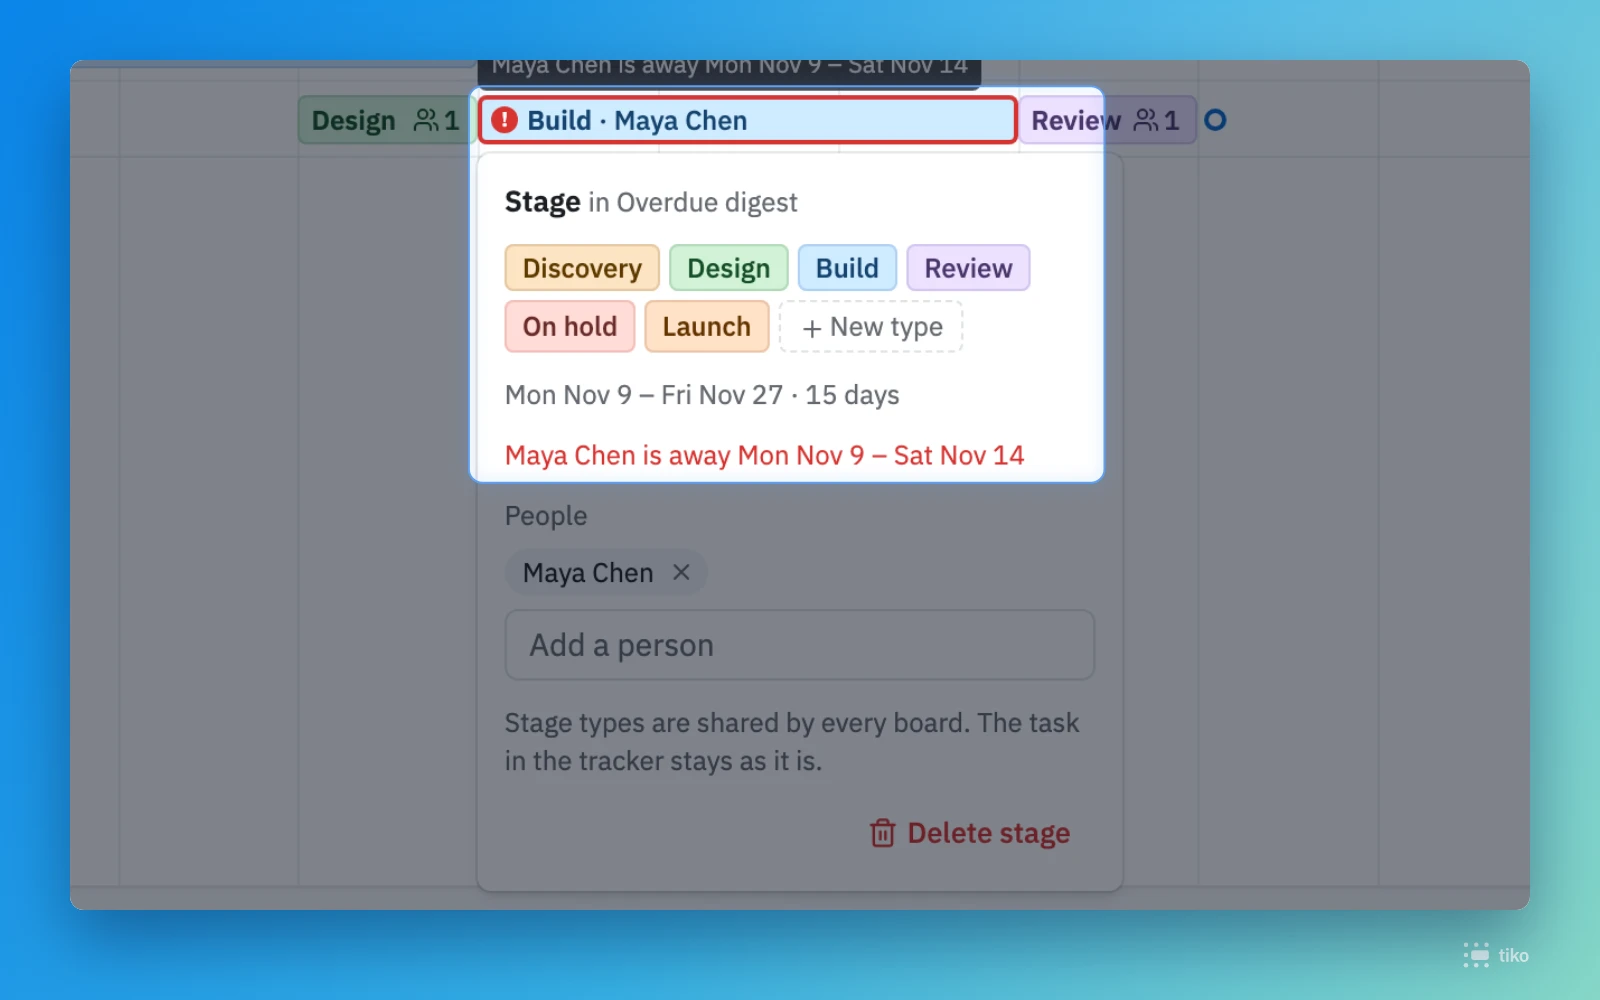
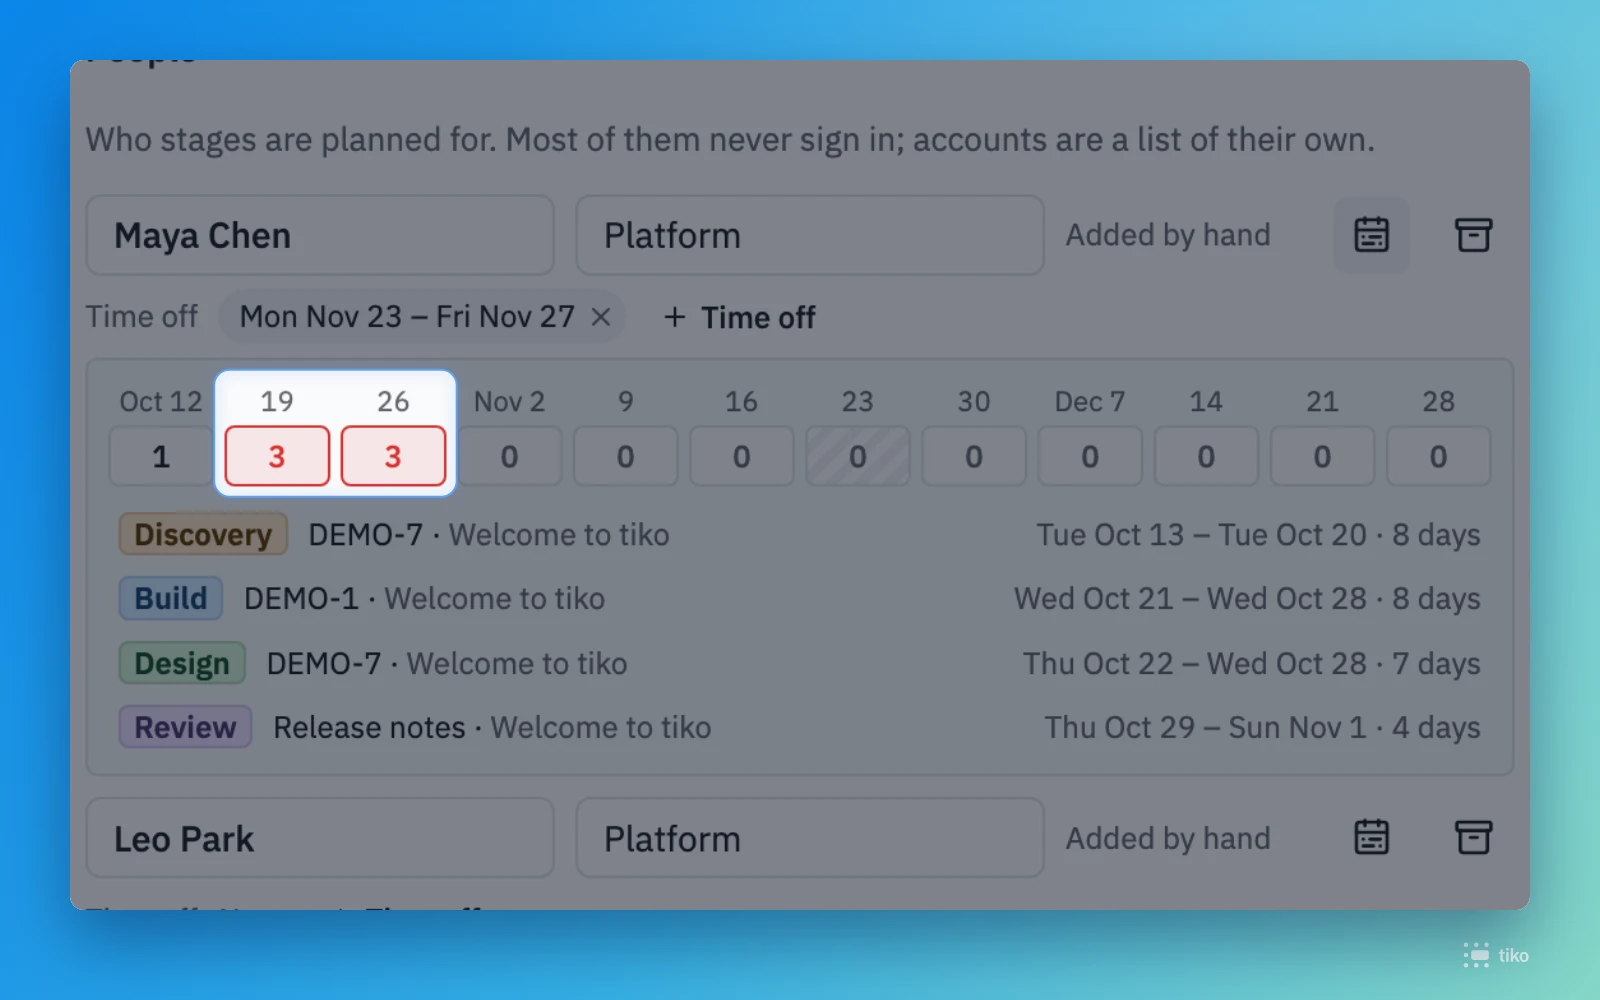
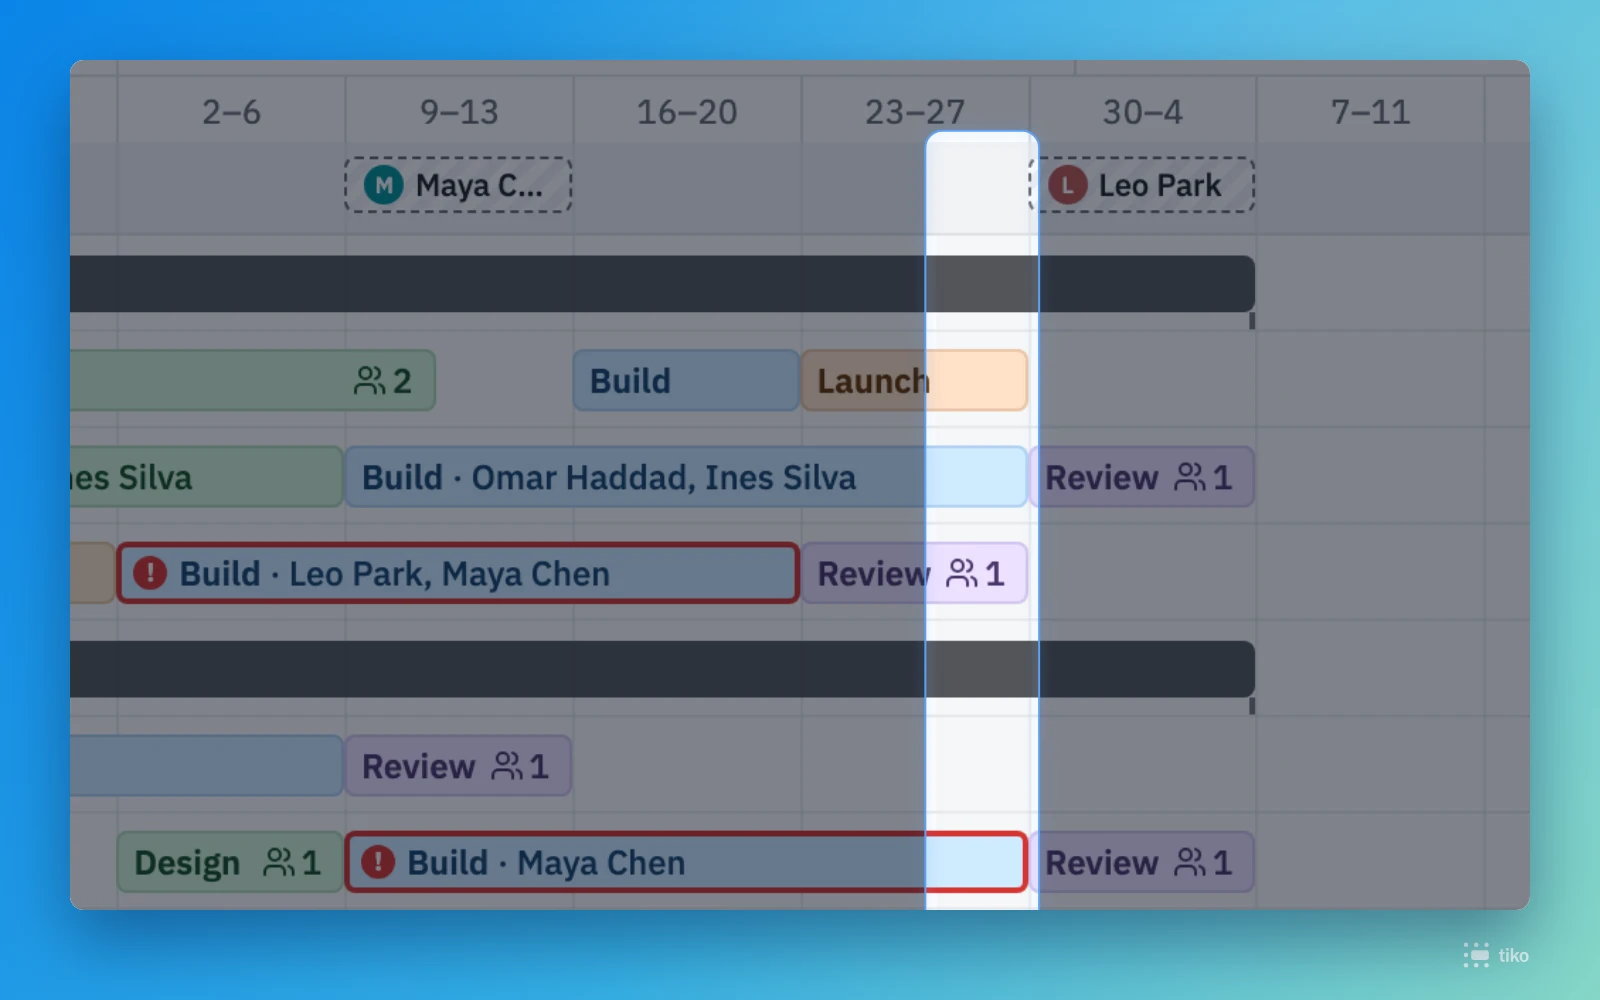
Mark when someone is away, once, and every Gantt where they have a stage shows it. A stage that clashes with time off gets a red outline, so you spot the problem before it happens.

What's inside

Draw it on the chart

Drag across the Time off lane and pick who is away. Their stages in those days turn red at once.

Who is away, and when

Open a red stage to see whose time off it overlaps.

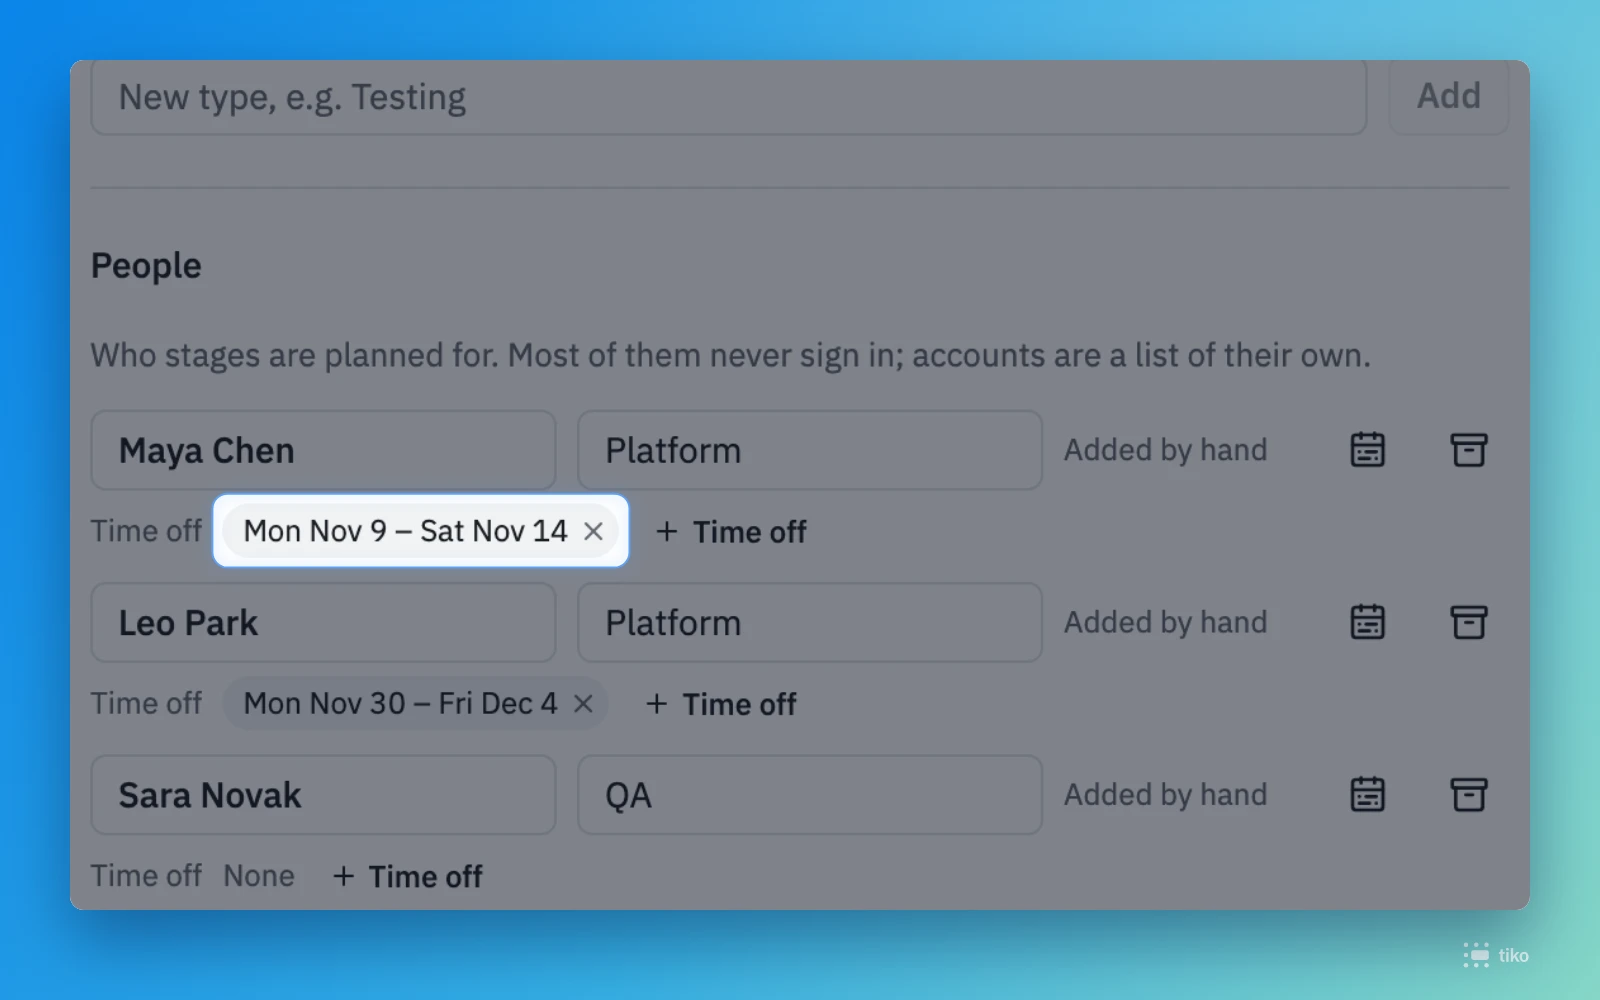
Or add it in Settings

Pick the first and last day under a person. tiko keeps only the dates, never the reason.

Read in the guide →

Settings

Workload

See the next twelve weeks of one person across every board, and the days they have two stages at once. Click a stage in the list to open its board.

What's inside

Clashes in red

A week turns red when two stages fall on the same working day. A week with time off is hatched.

Read in the guide →

Gantt

Working days

Hide weekends from a Gantt with Working days only. Stages snap to working days and every duration counts only the days people work.

What's inside

Weekends out of the way

Turn it on from the Gantt’s menu. Weeks then read Monday to Friday, such as 19–23.

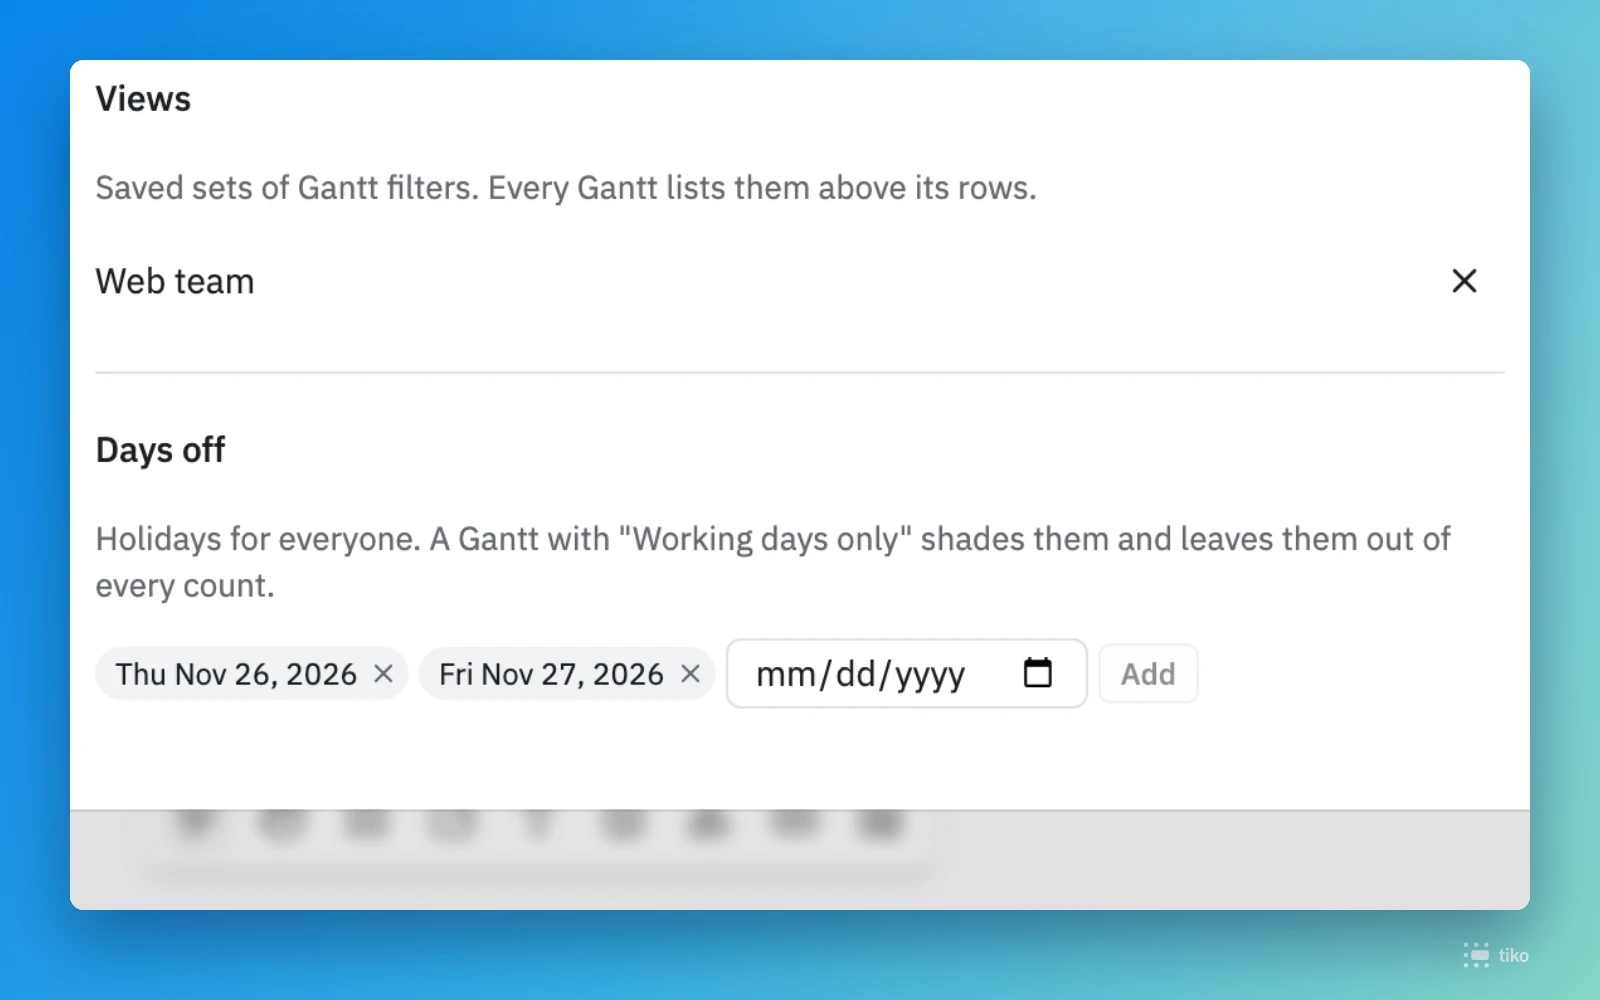
Holidays for everyone

Days off from Settings are shaded on the chart and left out of every count.

Durations you can trust

A stage from Monday to Friday reads 5 days, not 7.

Days off in Settings

Add a national holiday or a team day once, and every Gantt with working days respects it.

Read in the guide →
  • Gantt: The chart is easier to read: larger text and stages, taller rows, centered header labels and months spelled out.
  • Gantt: The Weeks scale shows months over weeks, and each week reads by its dates, such as 5–9, instead of a week number.
  • Guide: What’s new: a page for every release, with what you can try, short clips and pictures. Click a clip or a picture to see it full size.
  • Guide: Pages open without a full reload, the header stays in place, and the text is larger everywhere.
  • Guide: Fixed pages with code blocks jumping right after you open them.